Telemetry with Grafana
Dragon Telemetry enables users to monitor and collect data on critical factors like system performance, and resource utilization. Visualizations can be accessed real-time using Grafana. In this tutorial we will walk through how to enable, view, and add custom metrics using Telemetry.
Running Telemetry
Below is a simple example that initializes a Pool of workers that perform some computation. This is the base example that we will be building on top of during the remainder of this tutorial.
 1import dragon
 2import multiprocessing as mp
 3import time
 4import itertools
 5import random
 6
 7def worker(task_id):
 8    start_time = time.time()
 9    res = sum(i * i for i in range(task_id))
10    end_time = time.time()
11    duration = end_time - start_time
12    return f"Task {task_id} completed in {duration:.2f} seconds."
13
14def main():
15    num_cpus = 4
16    # Start Dragon
17    multiprocessing.set_start_method("dragon")
18    # Initialize the pool of workers
19    pool = mp.Pool(num_cpus)
20
21    tasks = [random.randint(900000000, 999999999) for _ in range(30)]
22    start = time.time()
23
24    results = pool.map(worker, tasks)
25    end = time.time()
26    total_duration = end - start
27    for result in results:
28        print(result, flush=True)
29
30    print(f"\nTotal execution time: {total_duration:.2f} seconds.", flush=True)
31    pool.close()
32    pool.join()
33
34if __name__ == "__main__":
35    # Initializes local telemetry object.
36    dt = dragon_telem()
37
38    main()
39
40    # This shuts down the telemetry collection and cleans up the workers and the node local telemetry databases.
41    # This only needs to be called by one process.
42    dt.shutdown()
 1> salloc -N 2 --exclusive
 2> dragon --telemetry-level=2 telemetry_tutorial.py
 3Port forwarded using:  ssh -NR localhost:34383:0.0.0.0:34383 pinoak-login1
 4Task 930680889 completed in 52.30 seconds.
 5Task 913000711 completed in 51.44 seconds.
 6Task 953078228 completed in 49.84 seconds.
 7Task 991416633 completed in 59.53 seconds.
 8Task 975347560 completed in 62.78 seconds.
 9Task 995407115 completed in 59.55 seconds.
10Task 996281122 completed in 52.75 seconds.
11Task 925282227 completed in 56.38 seconds.
12Task 913398131 completed in 49.62 seconds.
13Task 949008582 completed in 56.06 seconds.
Accessing Telemetry Metrics
Install Grafana
Grafana can be downloaded here . We suggest following the instructions provided by Grafana to install Grafana locally. Telemetry has been verified to be working with Grafana v12.1.0 (current latest) and is compatible with all versions starting from v10.4.x.
We have created a custom config YAML for Grafana OpenTSDB connection setup that can be found here https://github.com/DragonHPC/dragon/blob/main/src/dragon/telemetry/imports/custom.yaml.
Place this file where you have installed Grafana in grafana/conf/provisioning/datasources.
Do not replace default.yml
We have also provided a custom dashboard that can be found here https://github.com/DragonHPC/dragon/blob/main/src/dragon/telemetry/imports/Grafana_DragonTelemetryDashboard.json.
This dashboard can be imported in Grafana.
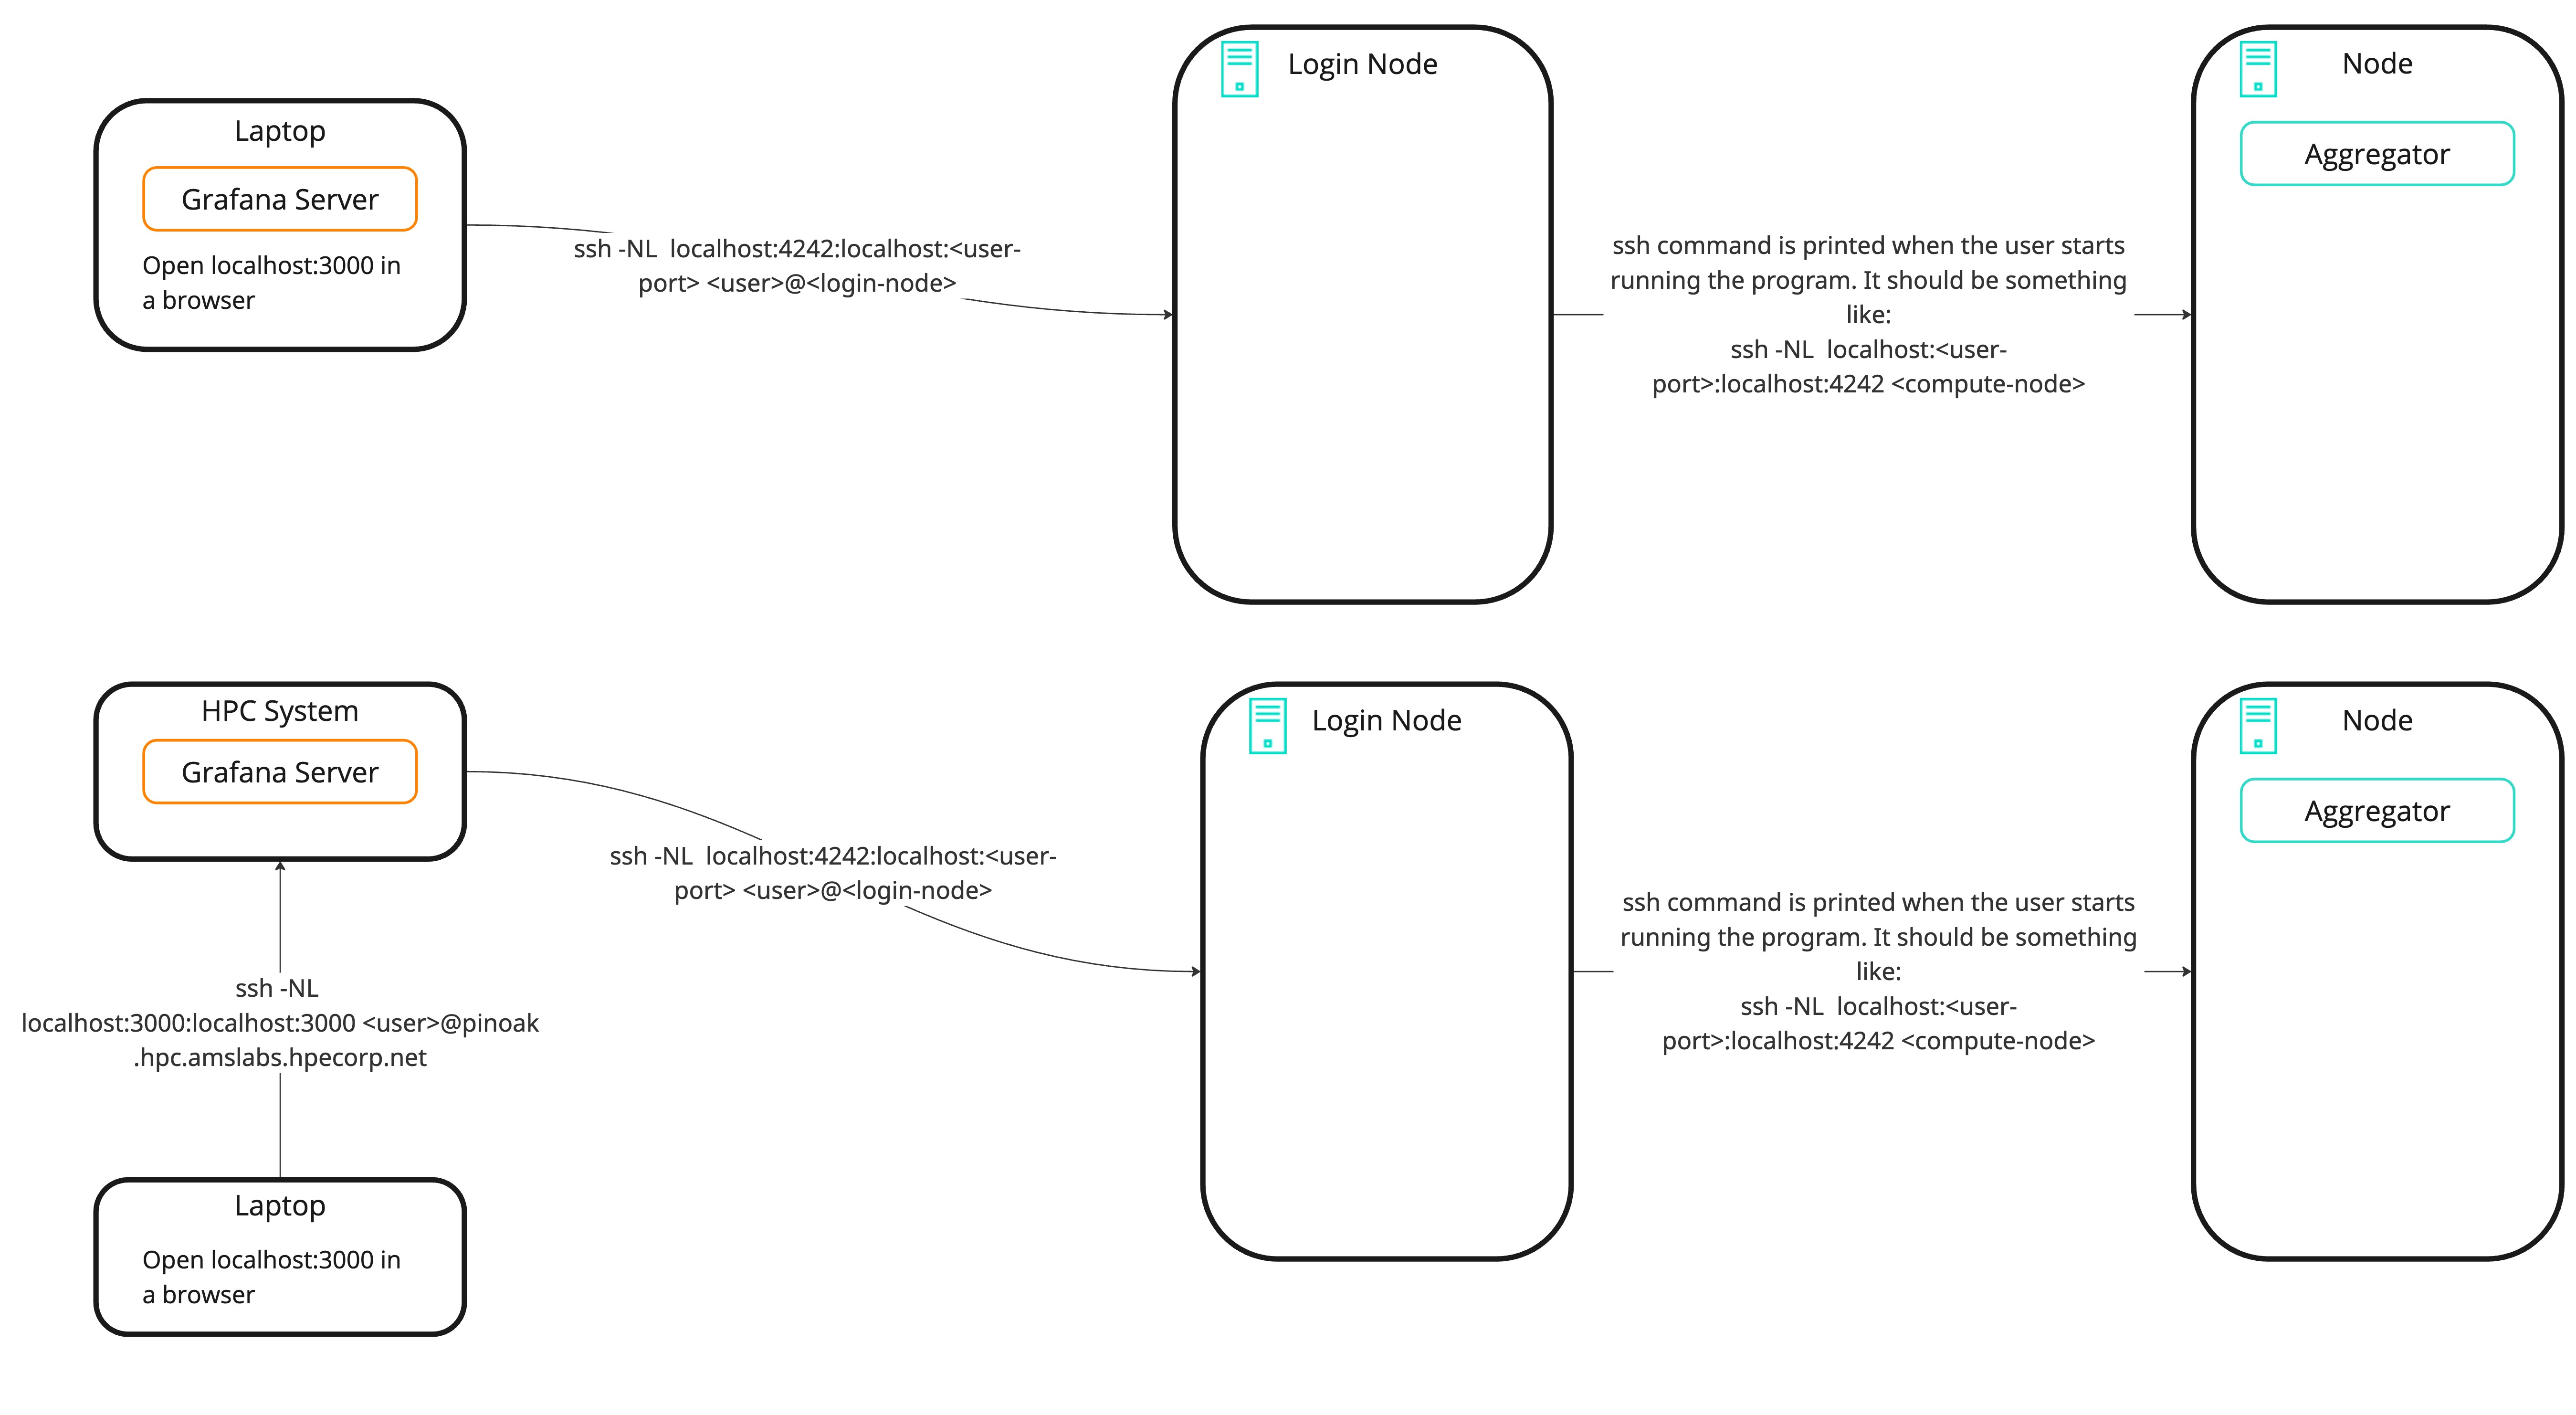
Port forwarding
There are two instances where port forwarding is required. These two port forwards together give Grafana access to the Aggregator to make requests for metrics.
- Aggregator
Compute node to login node
The command for this will be printed in the output when the application is run with the telemetry flag
Example -
ssh command: ssh -NL localhost:4242:localhost:4242 pinoak0027NOTE: Run this step only after the command has been printed for you.
- Grafana to Aggregator
This step may vary depending on where the Grafana server is running
- If Grafana is on localhost (laptop):
On laptop -
ssh -NL localhost:4242:localhost:4242 <user>@<login-node>
NOTE: This can be setup anytime and left running. This provides Grafana access to the dragon implementation of the OpenTSDB datasource. Users should still use the default
http://localhost:3000to open Grafana in their browser.
Grafana Dashboard
(Skip step 1. if you have added custom files to the config directory).
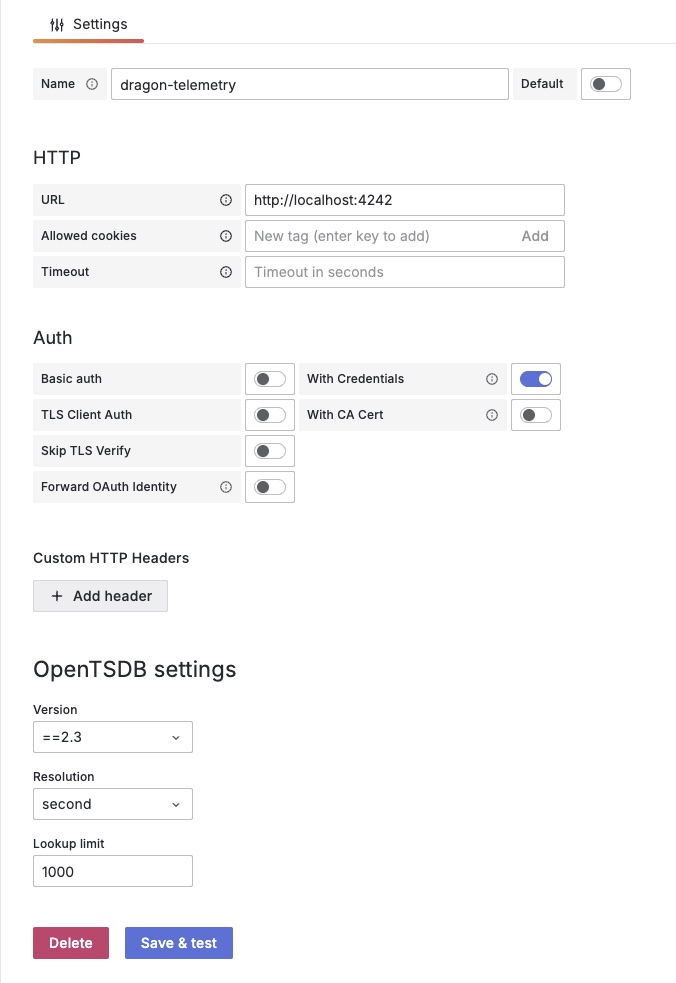
- Navigate to Home > Connections > Datasources. Click on Add New Datasource and selct OpenTSDB.
Fill in details as shown below. Click on Save & Test.
Navigate to Home > Dashboards. Click on New > Import. Upload the custom Dashboard.
Go to Home > Dashboards and select your dashboard. You should see something like below -
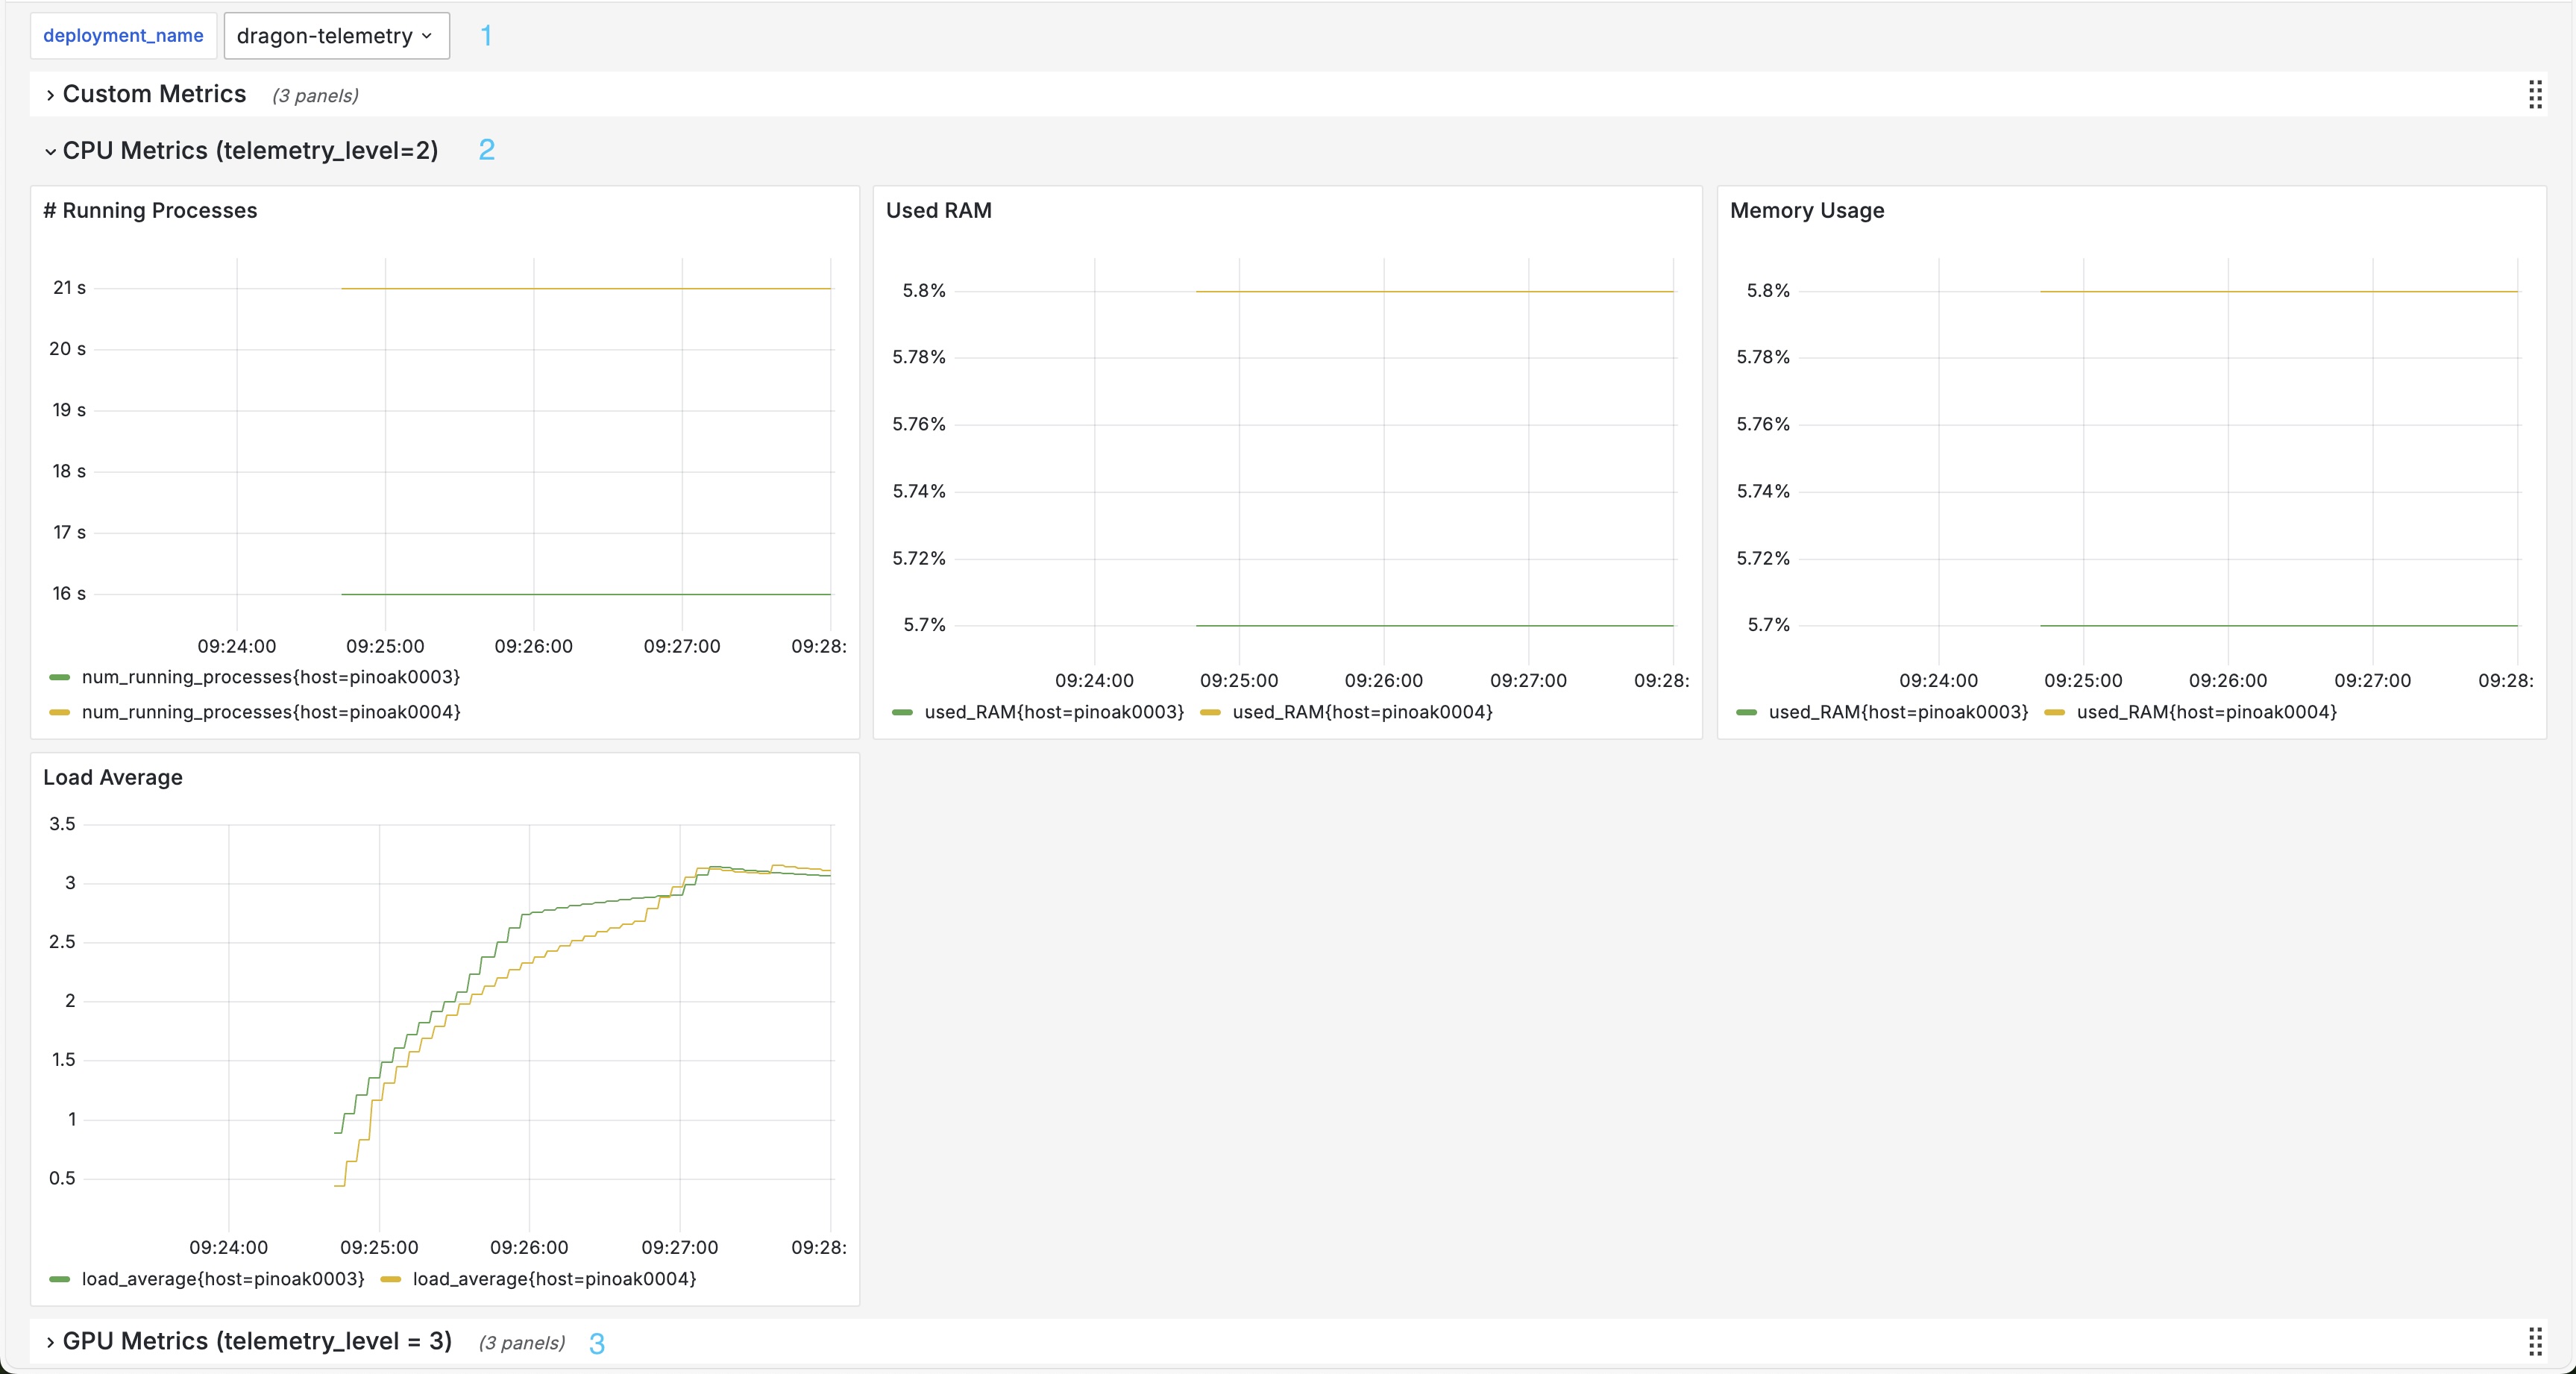
Select your datasource name from the dropdown [1]
These are CPU metrics [2]
Each row can be expanded for different telemetry levels. They have their own set of panels [3]
Click on the top right corner of any panel to edit it.
Troubleshooting
Sometimes metrics don’t show up on Grafana dashboard panels (if it’s the first time you’re running Grafana and Telemetry). To resolve this:
Verify that Grafana is able to access Telemetry by clicking on
Save & Testunder the OpenTSDB datasource.Refresh Grafana Panels individually
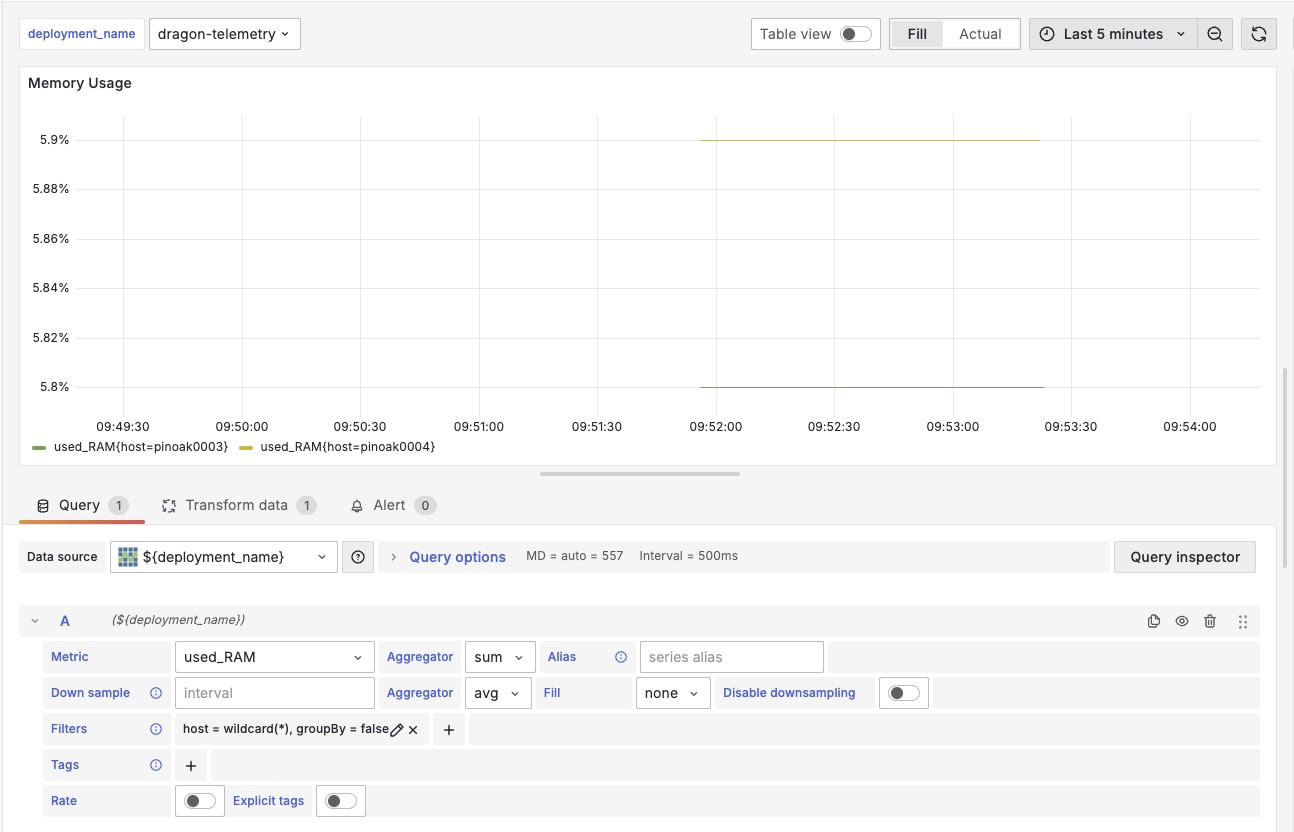
Click on the Edit option of any panel.
Click on the Datasource dropdown and re-select OpenTSDB
Click on the Metric dropdown and re-type the metric name.
Click on Apply (top-right corner)
Repeat for all panels
Save the Dashboard
Custom Metrics
To add custom metrics, we initialize Dragon Telemetry, and use the add_data method to add metrics.
Using the previous code, we will keep the main() function as is, and make the following changes to the rest of the code.
 1import dragon
 2import multiprocessing as mp
 3import time
 4import itertools
 5import random
 6from dragon.telemetry.telemetry import Telemetry as dragon_telem
 7
 8def worker(task_id):
 9    dt = dragon_telem()
10    start_time = time.time()
11    res = sum(i * i for i in range(task_id))
12    end_time = time.time()
13    duration = end_time - start_time
14    # Add custom metric
15    dt.add_data(ts_metric_name= "duration", ts_data=duration, telemetry_level=2, tagk="task_id", tagv=task_id)
16    return f"Task {task_id} completed in {duration:.2f} seconds."
17
18def main():
19    # Same as above code
20
21if __name__ == "__main__":
22
23    # Initializes local telemetry object.
24    dt = dragon_telem()
25
26    main()
27
28    # This shuts down the telemetry collection and cleans up the workers and the node local telemetry databases.
29    # This only needs to be called by one process.
30    dt.shutdown()
Telemetry levels
In the previous run we used the argument --telemetry-level=2. This means that metrics will be collected for all telemetry levels
that are less than or equal to the given telemetry level argument.
Running with --telemetry-level=3 enables GPU metrics.
User defined metrics are by default set to a telemetry level of 1 but can be changed, as demonstrated in the example. Running without the arg will mean that no telemetry data is collected. All of user generated telemetry data can be left in the user program but will not be collected.
Database Dump
Telemetry data can be dumped to persistent storage for post-run analysis.
To enable database dumps, use the AnalysisClient in your application:
 1from dragon.telemetry import Telemetry as dragon_telem, AnalysisClient
 2
 3if __name__ == "__main__":
 4    dt = dragon_telem()
 5    tac = AnalysisClient()
 6    tac.connect(timeout=60)
 7
 8    # Your application code here
 9    # ...
10
11    # Dump the database periodically or at the end
12    tac.db_dump()
13
14    dt.shutdown()
Specify a dump path in your telemetry.yaml config file. Run your application with telemetry enabled:
1> salloc --nodes=2 --exclusive
2> dragon --telemetry-level=2 your_application.py
After the runtime has exited, you can view the dumped metrics using the offline telemetry tool:
> salloc --nodes=1 --exclusive
> dragon-offline-telemetry
By default, offline telemetry runs on all nodes in the current allocation. You can specify a custom number of nodes using the -N argument:
> salloc --nodes=2 --exclusive
> dragon-offline-telemetry -N 1
Note
By default, only the last 5 minutes of telemetry data is retained for database dumps. For longer runs, adjust the default_tmdb_window parameter in your telemetry configuration (default: 300 seconds).
Metrics from offline telemetry can be accessed using Grafana as described above.