Multi-node process orchestration and node telemetry
This is an example of running ensembles of PyTorch and SciPy jobs with the Dragon runtime as well as gathering telemetry data using queues and events. It demonstrates the life-cycle management of many different processes and node monitoring using Dragon Multiprocessing.
In this example, we gather gpu utilization and the average cpu load over 1 minute. The SciPy job is similar to the one described in the SciPy Image Convolution Benchmark. The PyTorch job is similar to the PyTorch MNIST example and only differs in that each worker trains with a different learning rate. Currently only Nvidia GPUs are supported since we utilize the py3nvml package to gather the GPU utilization. AMD GPUs can be utilized by gathering similar info via rocm-smi directly.
The example consists of four components:
cpu computation: image processing using the SciPy library
gpu computation: training on the MNIST dataset
monitor processes: we start a single process on each node. Every such process gathers telemetry data and pushes the data into a single queue that is shared among the nodes
a post-processing process: this process gets the data from the queue, processes the data and then prints it. This process can live on any of the nodes, depending on the allocation scheme of Dragon. For now, Dragon follows a round-robin allocation over the available nodes. In the future, Dragon will provide different allocation schemes for the user to choose.
We start a pool of workers for the mnist computation, a different pool of workers for the SciPy computation, as many monitor processes as the number of nodes that Dragon uses (it could be a subset of the node allocation) and a single post-processing process. All the workers are distributed across the available nodes.
Fig. 1 presents the structure of a toy example with 4 compute nodes and shows the basic architecture and process placement. The shared queue lives on the same node as the process that created it. In our example, the head/main process creates the queue. The user main program and the head/main process live on compute node 1.
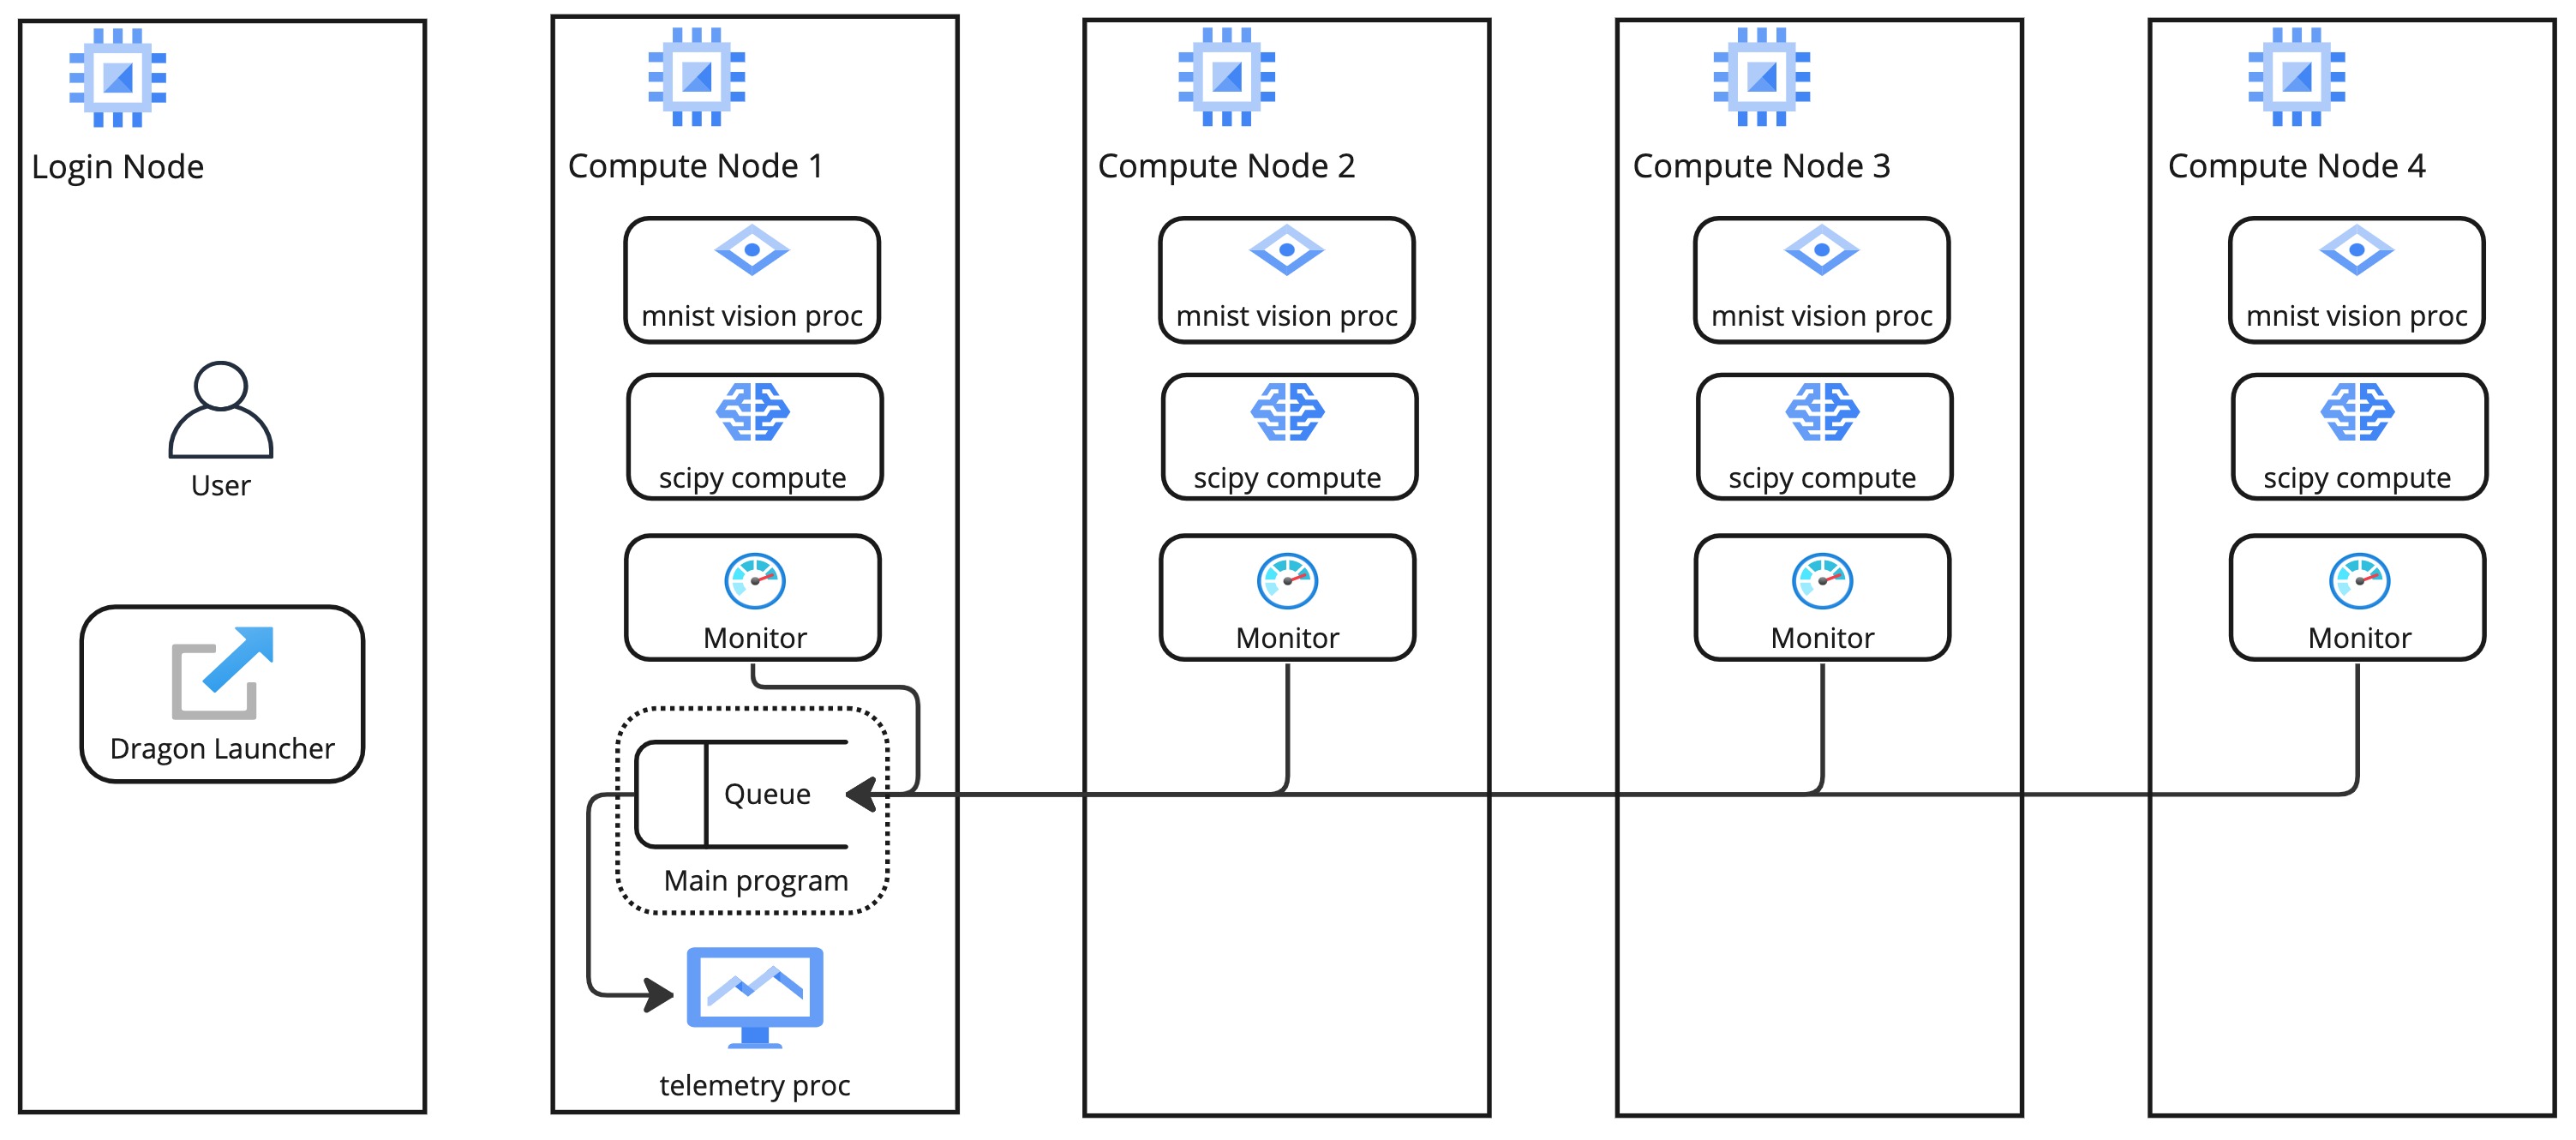
Fig. 1 Structure of the multi-node process orchestration and node telemetry demo on an allocation of 4 compute nodes
This example consists of the following python files:
telemetry_full.py- This is the main file. It imports the other files and orchestrates the telemetry work. It contains telem_work, which is the function launched on every node that gathers telemetry data and pushes it to a shared queue, and post_process, which is launched only on one node and reads the telemetry data from the queue and then prints that information.telem.py- This file has all the functions used to gather telemetry data on each node. It relies heavily on py3nvml to gather this data.mnist.py- This contains the functions used to run the mnist jobs and utilizes dragon queues to orchestrate GPU placement.conv.py- This contains all of the functions used for the SciPy convolution jobs.
Below, we present the main python code (telemetry_full.py) which acts as the coordinator of the whole demo, that combines all the different components.
The code of the other files can be found in the release package, inside examples/multiprocessing/torch-scipy-telemetry directory.
  1import dragon
  2from dragon.globalservices.node import get_list, query_total_cpus
  3import multiprocessing as mp
  4import argparse
  5import time
  6import os
  7import queue
  8
  9import functools
 10import mnist
 11import telem as tm
 12import conv
 13
 14def get_args():
 15    """Get the user provided arguments
 16    :return args: input args from command line
 17    :rtype args: ArgumentParser object
 18    """
 19    parser = argparse.ArgumentParser(description="SciPy and MNIST test with telemetry")
 20    parser.add_argument("--scipy_workers", type=int, default=2, help="number of scipy workers (default: 2)")
 21    parser.add_argument("--mnist_workers", type=int, default=2, help="number of mnist workers (default: 2)")
 22    parser.add_argument('--bars', action='store_true', default=False,
 23                        help='uses tqdm bars to print telemetry info')
 24    parser.add_argument('--no-cuda', action='store_true', default=False,
 25                        help='disables CUDA training')
 26    parser.add_argument("--size", type=int, default=1024, help="size of the array (default: 1024)")
 27    parser.add_argument(
 28        "--mem", type=int, default=(1024 * 1024 * 1024), help="overall footprint of image dataset to process (default: 1024^3)"
 29    )
 30    parser.add_argument('--batch-size', type=int, default=64, metavar='N',
 31                        help='input batch size for training (default: 64)')
 32    parser.add_argument('--test-batch-size', type=int, default=1000, metavar='N',
 33                        help='input batch size for testing (default: 1000)')
 34    parser.add_argument('--epochs', type=int, default=14, metavar='N',
 35                        help='number of epochs to train (default: 14)')
 36    parser.add_argument('--gamma', type=float, default=0.7, metavar='M',
 37                        help='Learning rate step gamma (default: 0.7)')
 38    parser.add_argument('--seed', type=int, default=1, metavar='S',
 39                        help='random seed (default: 1)')
 40    args = parser.parse_args()
 41
 42    my_args = parser.parse_args()
 43    return my_args
 44
 45def telem_work(q, start_ev, end_ev):
 46    """This is used by every monitoring process. It gathers telemetry data
 47    for CPU and GPU utilization and pushed it into the shared queue.
 48
 49    :param q: shared queue that stores the telemetry data for each node
 50    :type q: Dragon Multiprocessing Queue
 51    :param start_ev: event that signals the beginning of monitoring
 52    :type start_ev: Event
 53    :param end_ev: event that signals the end of monitoring
 54    :type end_ev: Event
 55    """
 56    print(f"This is a telemetry process on node {os.uname().nodename}.", flush=True)
 57    start_ev.wait() # wait until the starting event is set
 58    while True:
 59        gpu_info_list = tm.call_nvml()
 60        # one process on each node adds to a shared queue
 61        q.put(gpu_info_list)
 62        time.sleep(1)
 63
 64        # check if the end event is set. If yes, exit.
 65        if end_ev.is_set():
 66            print(f"Telemetry process on node {os.uname().nodename} exiting ...", flush=True)
 67            break
 68
 69def post_process(q, start_ev, end_ev, tqdm_bars):
 70    """This is used by the single post-processing process
 71    that gets the telemetry data from the shared queue and
 72    prints it.
 73
 74    :param q: shared queue that stores the telemetry data for each node
 75    :type q: Dragon Multiprocessing Queue
 76    :param start_ev: event that signals the beginning of monitoring
 77    :type start_ev: Event
 78    :param end_ev: event that signals the end of monitoring
 79    :type end_ev: Event
 80    :param tqdm_bars: flag that signals whether to use bars or not for the presentation of the telemetry data
 81    :type tqdm_bars: Boolean
 82    """
 83    print(f"This is the postprocessing process, {os.uname().nodename}.", flush=True)
 84    start_ev.wait() # wait until the starting event is set
 85    tqdm_dict = {} # used when bars are used for the presentation of the telemetry data
 86    while True:
 87        # single process reads from the shared queue and prints results
 88        try:
 89            results_telem = q.get(timeout=10)
 90            if tqdm_bars:
 91                tm.updateTelemDict(results_telem, tqdm_dict, deviceID=None)
 92            else:
 93                tm.printTelem(results_telem)
 94        # when the queue is empty, exit
 95        except queue.Empty:
 96            print("Post process is exiting", flush=True)
 97            break
 98        except Exception as e:
 99            print(f"Exception caught: {e}", flush=True)
100
101if __name__ == "__main__":
102    args = get_args()
103    print(f"Hello from main process {os.uname().nodename}.", flush=True)
104    print("using dragon runtime", flush=True)
105    mp.set_start_method("dragon")
106
107    # get the list of nodes from Global Services
108    nodeslist = get_list()
109    nnodes = len(nodeslist)
110
111    num_mnist_workers = args.mnist_workers
112    assert num_mnist_workers > 1
113    num_cpus = args.scipy_workers
114    print(f"Number of nodes: {nnodes}", flush=True)
115    print(f"Number of scipy workers: {num_cpus}", flush=True)
116    print(f"Number of MNIST workers: {num_mnist_workers}", flush=True)
117
118    # variable used to signal whether to use bars for the presentation of data or not
119    use_bars = args.bars
120
121    # Initialize the shared queue among the nodes
122    # that is used for the communication of the telemetry data
123    q = mp.Queue()
124
125    # event used to signal the beginning of monitoring processes
126    start_ev = mp.Event()
127    # event used to signal the end of monitoring processes
128    end_ev = mp.Event()
129
130    # Create a process that gets and processes the telemetry data
131    post_proc = mp.Process(target=post_process, args=(q, start_ev, end_ev, use_bars))
132    post_proc.start()
133
134    # Create a process on each node for monitoring
135    procs = []
136    for _ in range(nnodes):
137        proc = mp.Process(target=telem_work, args=(q, start_ev, end_ev))
138        proc.start()
139        procs.append(proc)
140
141    # Create a pool of workers for the scipy work
142    time.sleep(5)
143    scipy_data = conv.init_data(args)
144    scipy_pool = mp.Pool(num_cpus)
145
146    # Create a pool of workers for the mnist work
147    deviceQueue = mnist.buildDeviceQueue()
148    lr_list=[1/(num_mnist_workers-1)*i + 0.5 for i in range(num_mnist_workers)]
149    mnist_lr_sweep_partial = functools.partial(mnist.mnist_lr_sweep, args, deviceQueue)
150    mnist_pool = mp.Pool(num_mnist_workers)
151
152    # start telemetry
153    start_ev.set()
154
155    # launch scipy and mnist jobs
156    print(f"Launching scipy and mnist jobs", flush=True)
157    workers_mnist = mnist_pool.map_async(mnist_lr_sweep_partial, lr_list,1)
158    workers_scipy = scipy_pool.map_async(conv.f, scipy_data)
159
160    # wait on async processes
161    mnist_pool.close()
162    mnist_pool.join()
163    scipy_pool.close()
164    scipy_pool.join()
165
166    # set the event to signal the end of computation
167    time.sleep(10)
168    print(f"Shutting down procs", flush=True)
169    end_ev.set()
170
171    # wait on the monitoring processes and the post-processing process
172    for proc in procs:
173        proc.join()
174    post_proc.join()
175    q.close()
176
177    for result in workers_mnist.get():
178        print(f'Final test for learning rate {result[0]}: loss: {result[1]} accuracy: {result[2]}', flush=True)
Usage
It is used as follows:
1dragon telemetry_full.py [-h] [--scipy_workers NUM_SCIPY_WORKERS] [--mnist_workers NUM_MNIST_WORKERS] [--bars]
2                         [--no-cuda] [--size ARRAY_SIZE] [--mem IMAGE_MEM_SIZE] [--batch-size BATCH_SIZE]
3                         [--test-batch-size TEST_BATCH_SIZE] [--epochs NUM_EPOCHS] [--gamma GAMMA]
4                         [--seed SEED]
Optional arguments:
 1-h, --help            show this help message and exit
 2
 3--scipy_workers NUM_SCIPY_WORKERS
 4                    number of scipy workers (default: 2)
 5--mnist_workers  NUM_MNIST_WORKERS
 6                    number of mnist workers (default: 2)
 7--bars
 8                    uses tqdm bars to print telemetry data
 9--no-cuda
10                    disables CUDA training
11--size ARRAY_SIZE
12                    size of the array (default: 1024)
13--mem IMAGE_MEM_SIZE
14                    overall footprint of image dataset to process (default: 1024^3)
15--batch-size BATCH_SIZE
16                    input batch size for training (default: 64)
17--test-batch-size TEST_BATCH_SIZE
18                    input batch size for testing (default: 1000)
19--epochs NUM_EPOCHS
20                    number of epochs to train (default: 14)
21--gamma
22                    Learning rate step gamma (default: 0.7)
23--seed
24                    random seed (default: 1)
Installation
After installing dragon, the remaining packages needed to install are located in the requirements.txt file. The version of PyTorch and it’s dependencies may need to be made to run on other systems.
1> pip install -r requirements.txt
Alternatively, the packages and their dependencies can be installed individually. The PyTorch version and corresponding pip command can be found here .
1> pip3 install torch torchvision torchaudio
2> pip install py3nvml
3> pip install tqdm
4> pip install scipy
Description of the system used
For this example, an HPE Cray EX was used. Each node has AMD EPYC 7763 64-core CPUs and 4x Nvidia A100 GPUs.
How to run
Example Output when run on 2 nodes with 2 MNIST workers and 2 SciPy workers on Pinoak
 1> salloc --exclusive -N 2 -p allgriz
 2> dragon telemetry_full.py
 3Hello from main process pinoak0033.
 4using dragon runtime
 5Number of nodes: 2
 6Number of scipy workers: 2
 7Number of MNIST workers: 2
 8This is a telemetry process on node pinoak0033.
 9Number of images: 1024
10This is a telemetry process on node pinoak0034.
11This is the postprocessing process, pinoak0034.
12Launching scipy and mnist jobs
13nodename: pinoak0033 cpu load average 1 minute: 0.17 device # 0 utilization: 0.00%
14nodename: pinoak0034 cpu load average 1 minute: 0.34 device # 0 utilization: 0.00%
15nodename: pinoak0033 cpu load average 1 minute: 0.17 device # 0 utilization: 0.00%
16nodename: pinoak0034 cpu load average 1 minute: 0.34 device # 0 utilization: 0.00%
17nodename: pinoak0033 cpu load average 1 minute: 0.17 device # 0 utilization: 0.00%
18nodename: pinoak0034 cpu load average 1 minute: 0.72 device # 0 utilization: 0.00%
19nodename: pinoak0033 cpu load average 1 minute: 0.31 device # 0 utilization: 0.00%
20nodename: pinoak0033 cpu load average 1 minute: 0.31 device # 0 utilization: 0.00%
21nodename: pinoak0033 cpu load average 1 minute: 0.31 device # 0 utilization: 1.00%
22nodename: pinoak0033 cpu load average 1 minute: 0.31 device # 0 utilization: 0.00%
23nodename: pinoak0033 cpu load average 1 minute: 0.31 device # 0 utilization: 1.00%
24nodename: pinoak0033 cpu load average 1 minute: 0.69 device # 0 utilization: 0.00%
25nodename: pinoak0033 cpu load average 1 minute: 0.69 device # 0 utilization: 2.00%
26nodename: pinoak0033 cpu load average 1 minute: 0.69 device # 0 utilization: 10.00%
27nodename: pinoak0033 cpu load average 1 minute: 0.69 device # 0 utilization: 10.00%
28nodename: pinoak0033 cpu load average 1 minute: 0.96 device # 0 utilization: 10.00%
29nodename: pinoak0033 cpu load average 1 minute: 0.96 device # 0 utilization: 10.00%
30nodename: pinoak0034 cpu load average 1 minute: 0.91 device # 0 utilization: 0.00%
31nodename: pinoak0033 cpu load average 1 minute: 0.96 device # 0 utilization: 10.00%
32nodename: pinoak0034 cpu load average 1 minute: 0.91 device # 0 utilization: 2.00%
33.
34.
35.
36< More Telemetry Data >
37.
38.
39.
40nodename: pinoak0033 cpu load average 1 minute: 33.97 device # 0 utilization: 2.00%
41nodename: pinoak0034 cpu load average 1 minute: 29.7 device # 0 utilization: 3.00%
42nodename: pinoak0033 cpu load average 1 minute: 33.97 device # 0 utilization: 0.00%
43nodename: pinoak0034 cpu load average 1 minute: 29.7 device # 0 utilization: 0.00%
44nodename: pinoak0033 cpu load average 1 minute: 33.97 device # 0 utilization: 0.00%
45nodename: pinoak0034 cpu load average 1 minute: 27.4 device # 0 utilization: 0.00%
46.
47.
48.
49< More Telemetry Data >
50.
51.
52.
53Shutting down procs
54Telemetry process on node pinoak0033 exiting ...
55Telemetry process on node pinoak0034 exiting ...
56Post process is exiting
57Final test for learning rate 0.5: loss: 0.02791020164489746 accuracy: 99.1
58Final test for learning rate 1.5: loss: 0.027457854652404787 accuracy: 99.21
Running with –bars will print the information using tqdm bars that are updated. The utilization for all GPUs on each node will be printed along with the cpu load average. Mid-run the output should look like:
 1> dragon telemetry_full.py --bars
 2Hello from main process pinoak0033.
 3using dragon runtime
 4Number of nodes: 2
 5Number of scipy workers: 2
 6Number of MNIST workers: 2
 7This is the postprocessing process, pinoak0034.
 8This is a telemetry process on node pinoak0033.
 9This is a telemetry process on node pinoak0034.
10Number of images: 1024
11Launching scipy and mnist jobs
12pinoak0034 cpu load avg.:  22%|██▏       | 22.07/100 [00:55<03:14,  2.50s/it]
13pinoak0034 device 0 util:   9%|▉         | 9/100 [00:55<09:17,  6.13s/it]
14pinoak0034 device 1 util:   0%|          | 0/100 [00:55<?, ?it/s]
15pinoak0034 device 2 util:   0%|          | 0/100 [00:55<?, ?it/s]
16pinoak0034 device 3 util:   0%|          | 0/100 [00:55<?, ?it/s]
17pinoak0033 cpu load avg.:  15%|█▌        | 15.03/100 [00:54<05:09,  3.64s/it]
18pinoak0033 device 0 util:   9%|▉         | 9/100 [00:54<09:13,  6.08s/it]
19pinoak0033 device 1 util:   0%|          | 0/100 [00:54<?, ?it/s]
20pinoak0033 device 2 util:   0%|          | 0/100 [00:54<?, ?it/s]
21pinoak0033 device 3 util:   0%|          | 0/100 [00:54<?, ?it/s]
Example Output when run on 4 nodes with 8 MNIST workers and 16 SciPy workers on Pinoak
We can run with more nodes and utilize more GPUs per node by increasing the number of MNIST workers. For example, in the following we see that devices 0 and 1 are used on all 4 nodes.
 1> dragon telemetry_full.py --scipy_workers 16 --mnist_workers 8 --epochs 3 --bars
 2Hello from main process pinoak0033.
 3using dragon runtime
 4Number of nodes: 4
 5Number of scipy workers: 16
 6Number of MNIST workers: 8
 7This is a telemetry process on node pinoak0035.
 8This is a telemetry process on node pinoak0036.
 9This is a telemetry process on node pinoak0034.
10This is the postprocessing process, pinoak0034.
11This is a telemetry process on node pinoak0033.
12Number of images: 1024
13Launching scipy and mnist jobs
14pinoak0033 cpu load avg.:  22%|██▏       | 21.73/100 [00:32<01:57,  1.51s/it]
15pinoak0033 device 0 util:   8%|▊         | 8/100 [00:32<06:16,  4.09s/it]
16pinoak0033 device 1 util:   8%|▊         | 8/100 [00:32<06:16,  4.09s/it]
17pinoak0033 device 2 util:   0%|          | 0/100 [00:32<?, ?it/s]
18pinoak0033 device 3 util:   0%|          | 0/100 [00:32<?, ?it/s]
19pinoak0034 cpu load avg.:  11%|█▏        | 11.42/100 [00:32<04:10,  2.83s/it]
20pinoak0034 device 0 util:   8%|▊         | 8/100 [00:32<06:11,  4.04s/it]
21pinoak0034 device 1 util:   9%|▉         | 9/100 [00:32<05:26,  3.59s/it]
22pinoak0034 device 2 util:   0%|          | 0/100 [00:32<?, ?it/s]
23pinoak0034 device 3 util:   0%|          | 0/100 [00:32<?, ?it/s]
24pinoak0035 cpu load avg.:  16%|█▋        | 16.46/100 [00:32<02:45,  1.98s/it]
25pinoak0035 device 0 util:   9%|▉         | 9/100 [00:32<05:29,  3.62s/it]
26pinoak0035 device 1 util:   8%|▊         | 8/100 [00:32<06:14,  4.07s/it]
27pinoak0035 device 2 util:   0%|          | 0/100 [00:32<?, ?it/s]
28pinoak0035 device 3 util:   0%|          | 0/100 [00:32<?, ?it/s]
29pinoak0036 cpu load avg.:   7%|▋         | 6.56/100 [00:32<07:44,  4.97s/it]
30pinoak0036 device 0 util:   8%|▊         | 8/100 [00:32<06:14,  4.07s/it]
31pinoak0036 device 1 util:   9%|▉         | 9/100 [00:32<05:29,  3.62s/it]
32pinoak0036 device 2 util:   0%|          | 0/100 [00:32<?, ?it/s]
33 ... (more hidden) ...
The same shut down message as above will be printed when the job is finished. Note, the first time this is run, the MNIST data set will be downloaded and will lead to additional output.